Infographic Friday: The Customer Experience
It’s time for another edition of Infographic Friday. Today’s content comes to us from Revel Foundry regarding customer experience and loyalty. While this specific infographic is not sports-specific, I feel there are several key lessons that apply to the industry, especially around the live event experience as compared to at-home viewing.
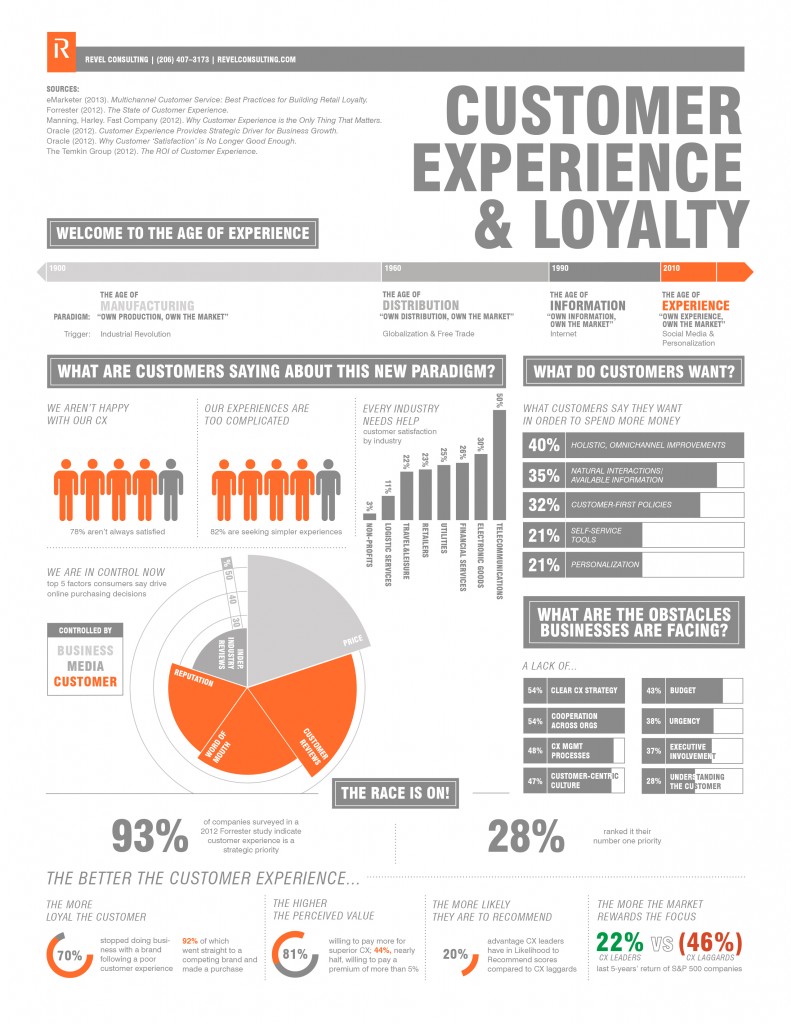
- 40% of customers what holistic, omni-channel improvements. We can’t think of the elements of a fan experience in silos. True experience improvements takes coordination across many departments.
- More than 50% of online purchasing decisions are customer-controlled. With more and more ticket purchasing happening online without direct fan conversations, these elements of reputation and word of mouth are more critical than ever.
- 70% of customers stopped doing business with a brand following a poor experience. There are many things that can lead to a poor experience at a stadium, from long lines to unruly patrons, so even small changes here could have large impacts on retaining fans.
- 81% of customers are willing to pay more for a better experience. Teams wants ways to justify more expensive tickets, and outside of the on-field product, this should be the best way to do it.
My last point to add is that the optimal customer experience will vary across your customer base. What a 25-year old, tech-savvy, single-game buyer wants compared to a 50-year old, long-time season ticket holder wants in their live experience are usually not the same. As you work on your live experience strategy, use research to make sure an improvement for one group doesn’t turn into a detractor for another group.
Check out the full infographic below or click here to see the original PDF and article at revelfoundry.com.
My name is Russell Scibetti and I have an extensive background in sports business, including CRM and database marketing, interactive and digital marketing, social media, corporate sponsorships and activation, and applied market research. From 2007 to 2014, I worked for Arizona State Athletics, Comcast-Spectacor (Philadelphia Flyers) and the New York Jets to manage and implement CRM, database marketing, market research and other technology-based sales and marketing initiatives. In 2014, I joined KORE Software as their VP of Product Strategy, where I am responsible for the strategic vision, planning and development of the KORE ProSports Ticketing, Sponsorship and Suites/Premium software products. I earned my MBA in Sports Business from the W.P. Carey…...
Read morePublished
Author
