
“Free” License - Excel is on every desktop, usually paid for already and only a click away. It makes artefacts instantly consumable, too. Worst case Microsoft has a free viewer for Excel.
Grid Control - For the longest time, getting a powerful equivalent grid control to Microsoft’s was a challenge, especially for vendors coming out of an OLTP angle.
Functional Richness - Though probably 99% of users never see, use and know it - Excel can do amazing things for the 1% (or less) power users.
So no question – to unseat Excel is really hard, but then the product has some weaknesses. Even though it offers easy template creation, users have to do things over and over again. How often have you created the infamous pie or bar chart (again and again … and again)? What if a product could ‘sense’ semantics and offer the appropriate tools, processes and visualization, right out of the box?
In my view I thought the Microsoft competitors had largely given up – to my surprise I stumbled over an unlikely entrant – Informatica’s Springbok (a codename that likely will change, currently the product is pilot mode). [Please note that the Excel competitive / replacement position is my interpretation, Informatica is not officially positioning the product as such.]
|
Screenshot of Springbok sample data sheet with automated insights |
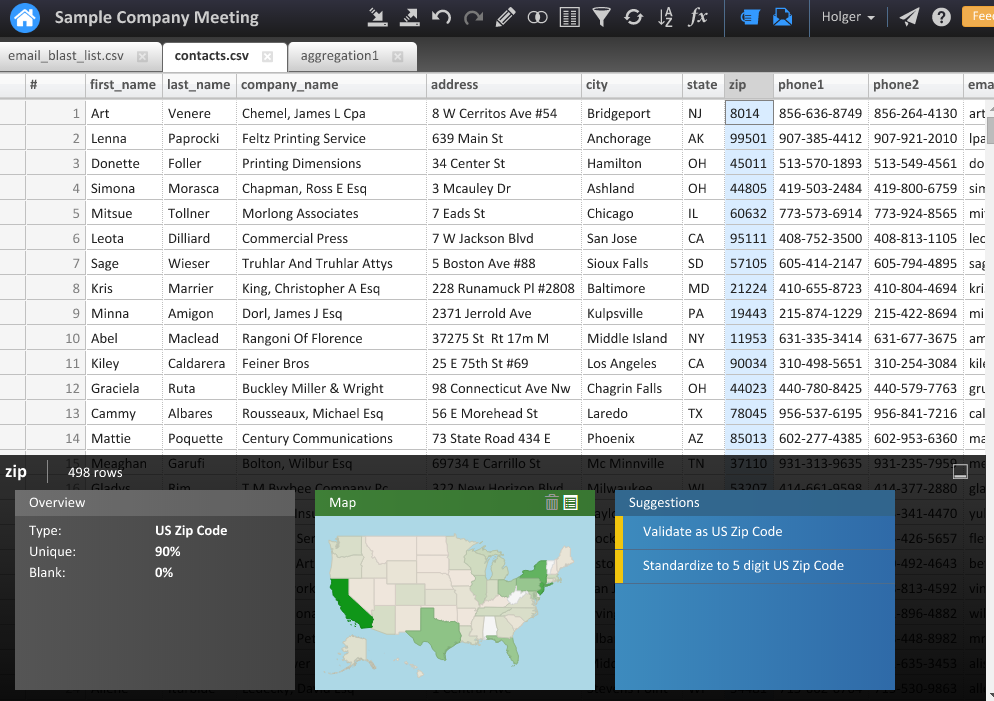
There are some things Informatica has done remarkably well – and these will create significant value for the average business user:
Just upload your data – and Springbok will make sense of it. As simple as it sounds – this is really hard. But pretty well solved and addressed.
Besides the usual functional menu, Springbok offer the user directly value enrichment. If the user clicks e.g. on a column with zip codes, Springbok offers a distribution of them. Click on a column with state data, Springbok offers a map of the USA with states highlighted by frequency in the data set.
Complex out of the box functions are just ‘there’ – no need to code, integrate or even procure (though I am sure at some point users will have to pay for enhanced services such as Dun & Bradstreet validation and normalization).
MyPOV – The Swiss Army knife approach of Microsoft Excel has its merits – but requires users to do things over and over again. More out of the box capability to ‘make sense of the data’ will be welcome by busy business users who look for any chance to save some time and avoid often boring repetitive tasks. Informatica’s Springbok is a good starting point, worth to have a look as a free trial here and should encourage other players to enter the market.
More on Informatica:
Informatica pushes the cloud integration stakes - read here.
Musings - How Technology Innovation fuels Recruiting and disrupts the Laggards - read here
Musings - What is the future of recruiting? Read here
HRTech 2014 takeaways - Read here.
Why all the attention to recruiting? Read here.
Could the paycheck re-invent HCM – yes it can – read here.
And suddenly, payroll matters again! Read here.

