From Relational Databases to Graph Database Interpretations - Creating Business Value through determining relationships in IoT Data
Much has been said about Big Data analytics, usually in the context of a definable set of Business goals that allow, equally definable, context to be placed on the data collected. Internet of Things, IoT, massively increases the amount of data points, or flow, as well as looking for a real-time interpretation. To see unique ‘Insights’, or to launch reactive processes, requires a wholly different approach to conventional databases and analytical tools.
Data Graphs are emerging as the Data model for IoT architected solutions building on successful deployments for interpreting complex Social Media data.
Research report now available: The Foundational Elements for the Internet of Things (IoT)
Fog Computing together with Cloud Computing lays down the connectivity architecture to deploy and operating billions of Devices in a cohesive manner. However the Business Value doesn’t lie in the connectivity, but in the data and real-time insights that have had no obvious relational Database context. The very different manner in which a Data Graph stores data is uniquely suited to IOT data flows and the connectivity architecture of Fog and Clouds.
What is a Data Graph, and how, is it the answer for the specific challenges of IoT? Rather than starting with a technology definition, it might be easier to start by understanding the benefits with a real example. A popular and well-known deployment of Data Graph that delivers a unique business value unobtainable by conventional means is Google Photos. Google does not sell storage so on the face of it providing free storage for millions of photos doesn’t make sense, but it does sell advertising. If Google can find a way to profile people better, then its core business proposition, and resulting revenues, from targeted advertising increases.
Google Photos uses Graph Data to provide an analysis of stored photos to figure out from unrelated, undefined photo collections, what a person’s interests and personal relationships might be. The challenge is how to do this at scale and in a timely manner to make advertising offers both relevant and immediate to actions.
A in-depth look at exactly why and how Google use Data Graph can be found in Blumenthals article “Google Photos a visual graph of people places and things”. If you personally wish to experiment with using the power of Data Graphs to search through complex data then the CNet article defining “Five Ways to put Facebook Graph Search to use” provides a practical guide.
With the understanding of what Data Graphs can do, then it is easier to understand what a Graph Database actually is, and even more important why it is so important in the emerging global landscape of mass IoT devices. However this is not the place to provide a fully detailed explanation merely to draw attention to the rising importance of Graph Data. For a greater level of understanding there is an excellent video tutorial that will help both business and technology managers entitled Graphs to power Connected Things. The simple, working summary explanation would go as follows;
Graphs represent data by common denominators and connections; as such Graph Databases are therefore a natural way to represent the connected IoT environment and store originating data. There is no other type of database that works in this manner and enables facilitates rapid matches to be made from the huge amount of complicated relationships and interdependencies that make up an IoT environment.
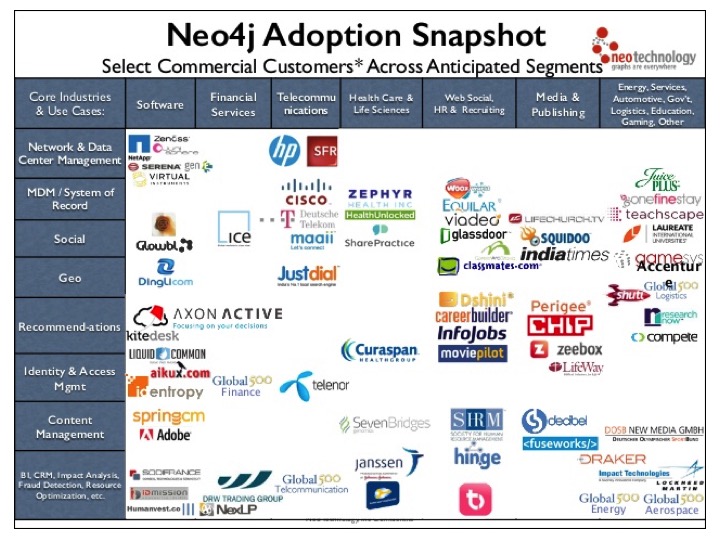
As might be expected with the rising popularity of the topic there is a huge amount of useful information on Graph Databases to be found on Wikipedia. This includes some highly informative tables of most, if not all, the popular Graph Database types as well as comparisons of their functionality and APIs. This alone makes it a very valuable resource for anybody contemplating developing a Graph Database for a project and wishing to make an informed choice. Wikipedia also notes that Neo4J is the most popular and widely deployed Graph Database, a point the snap shot illustration below listing types of deployment by well-known companies makes clear, as well as showing the level of interest by major Enterprises.
Graph Databases are important part of IoT capabilities, and architecture, due to their unique characteristics that mimic the very structure of a connected interactive network of data flows. The much-hyped Business Value said to emulate from the growth in IoT Devices and the availability of new forms of data requires the use of Graph Databases in association with to a new generation of Analytics and Event Processing.
Irrespective of role, both Business and Technology, managers increasingly must work to understand the art of the possible, to define and deploy competitive business plays. Data is well understood to be at the heart of this, with Graph Data becoming the new differentiating capability in the world of connected IoT Devices.
Resources
The Foundational Elements for the Internet of Things (IoT)
More on Graph Databases:
An excellent presentation that brings together all aspects of Graph used to support IoT; http://www.iaria.org/conferences2015/filesDBKDA15/graphsm_privat_popovici.pdf
O’Reilly’s eBook explaining Graph Databases for those involved in development; http://graphdatabases.com/?ref=blog&_ga=1.93704735.303205197.1444547872
A link to a huge real time example plotting aircraft movements and used to illustrate the scalability of Graph; http://graphofthings.org
Andy Mulholland is Vice President and Principal Analyst focusing on cloud business models. Formerly the Global Chief Technology Officer for the Capgemini Group from 2001 to 2011, Mulholland successfully led the organization through a period of mass disruption. Mulholland brings this experience to Constellation’s clients seeking to understand how Digital Business models will be built and deployed in conjunction with existing IT systems. Coverage Areas Consumerization of IT & The New C-Suite: BYOD, Internet of Things, IoT, technology and business use Previous experience: Mulholland co authored four major books that chronicled the change and its impact on Enterprises starting in 2006 with the well-recognised book ‘Mashup Corporations’ with Chris Thomas of Intel. This was followed in…...
Read morePublished
Author
