Technology Investment Already Recovered. What Comes Next?
The question that led to the Enterprise Technology Expansion Index was whether 2027 would be the year enterprise technology investment finally came back. It seemed like a reasonable starting point. A vendor could see customers delay decisions and conclude that spending was still weak. A technology executive could see a growing portfolio of commitments and wonder why so little of it had made its way into everyday operations.
Both could be right. Neither observation told us what was happening to investment across the economy. And when we reconstructed the U.S. investment series, the data changed the premise: the recovery was already visible in 2025. The question for 2027 is how far that investment reaches beyond the areas where it is already strong, and how much of it becomes useful operating capability.
The U.S. Enterprise Technology Expansion Index (ETEI) is now available. The Q2 and Q3 2026 reports and a standalone methodology accompany the launch. We’ll update the index quarterly, targeting publication on the 10th of February, May, August, and November, once the official data are available and the checks are complete.
What’s ETEI?
The U.S. Enterprise Technology Expansion Index tracks investment in software and information-processing equipment against its 2017–2019 benchmark (set at 100) and relative to overall business investment. It gives enterprise buyers and vendors a common view of the investment cycle. The index measures investment patterns; it doesn’t show how widely demand is spreading, which vendors benefit, or what returns buyers realize.
What we decided to measure
An early version tried to answer too many questions at once. Could software investment tell us whether enterprises were retiring legacy systems? Could employment in systems design tell us whether they had the capacity to implement what they bought? Could productivity tell us what technology had returned? These were useful questions. The available national data couldn’t answer them directly. An enterprise can buy a replacement and keep paying for the system it was meant to retire. A rise in productivity doesn’t tell us which investment made the difference.
So we narrowed the index to something we could measure and reproduce: the strength of U.S. private investment in software and information-processing equipment, and how that investment is doing relative to business investment overall.
ETEI uses quarterly data from the U.S. Bureau of Economic Analysis, distributed through FRED. Investment Momentum, 60% of the index, tracks year-over-year real growth in software and equipment investment. Capital Commitment, the other 40%, tracks how much faster real technology investment is growing than total nonresidential investment and how technology’s share of that investment has changed in current dollars. We standardize each input against its own 2017–2019 history and set the combined average for that period to 100.
Above 100 means the measured investment dynamics are stronger than the reference period. A decline means those dynamics softened; investment dollars can still be rising. The series includes providers’ own equipment purchases and software companies build for themselves. A high reading can therefore coexist with a difficult sales quarter for a vendor or a tight operating budget for an enterprise.
What Q3 tells us
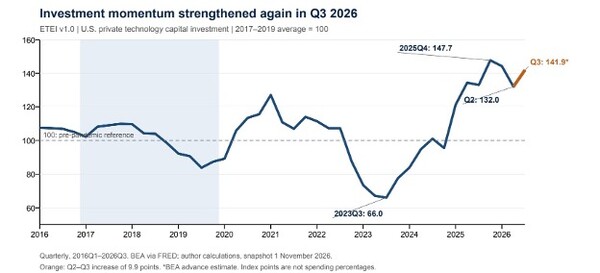
The reconstructed series reached 66.0 in Q3 2023 and 147.7 in Q4 2025. It eased to 132.0 in Q2 2026 before rising 9.9 points to 141.9 in Q3. Both components improved, and the Q2 reading was unchanged in the new snapshot. The rise came from the new quarter’s data.
Real technology investment grew 20.6% from a year earlier, with equipment up 29.1% and software up 12.8%. Software strengthened, but equipment still accounted for most of the above-baseline momentum. For vendors planning 2027, that distinction matters: infrastructure investment and an enterprise application purchase sit at different points in the investment chain. For enterprise buyers, the national figures provide context for their plans; whether to scale a program still depends on delivery, use, and the economics of running it.
Three paths from 2027 to 2031
The history gives us a reason to expect changes in pace, even within an expansion. It gives us much less basis for predicting an index level five years out. These are scenarios to test against each quarterly release.
1. Investment broadens into enterprise use. In 2027, the first sign would be sustained software strength alongside equipment investment, accompanied by funded orders across more industries. By 2028–29, the stronger evidence would be repeat deployments, sustained use, and old costs actually coming out. By 2030–31, the index could move closer to 100 as growth normalizes while enterprises get more from what they have installed. A lower reading in that setting could accompany a healthier operating cycle.
2. Investment stays strong but concentrated. In 2027, equipment could keep leading while vendors outside the strongest buying segments see little improvement in orders. Through 2028–29, investment may remain concentrated among infrastructure providers and a relatively small group of large buyers. By 2030–31, broader demand would depend on whether that capacity becomes economically useful to a wider set of customers. The index can flag continued investment strength; evidence on who buys and who deploys would have to establish whether the opportunity is spreading.
3. The buildout slows before demand broadens. In 2027, tougher comparisons with the recent surge could pull ETEI down even while real investment grows. A more consequential turn in 2028–29would show up in repeated declines in real investment levels, weaker orders, and deferred capacity commitments. By 2030–31, a durable recovery would require renewed investment backed by customer demand and viable operating economics. A single quarter below 100 would tell us much less than that sequence.
Each quarterly report will ask what changed, what drove it, and which of these paths the new evidence supports. The first question was when investment would come back. The more useful question now is where that investment turns into purchases, sustained use, and value. ETEI gives us a way to track the capital side of that answer.
Esteban Kolsky spent the first part of his professional career working on the customer service front line and in management roles, culminating in early implementations of first-generation CRM tools. In 2000, he became a research analyst at Gartner, focused on CRM, customer service, customer experience management, enterprise feedback management, and voice of the customer, among topics that later became the basis for the current field of CX. During his tenure at Gartner, Kolsky assisted vendors and Global 2000 organizations with their customer strategies. He left Gartner to focus his career on strategic advisory services and influenced all the major software vendors, as well as many smaller vendors, in the CX industry and advised executive leadership teams across industries and countries…...
Read morePublished
Author